Ionosonde & Ionogram
Ionosondes are test instruments used to generate ionograms and assist determining the state of the ionosphere and selecting the optimum frequencies for HF radio communication.
Ionospheric propagation tutorial includes . . . .
Ionospheric propagation
Ionosphere
Ionospheric layers
Skywaves & skip
Critical frequency, MUF, LUF & OWF
How to use ionospheric propagation
Multiple reflections & hops
Ionospheric absorption
Signal fading
Solar indices
Propagation software
NVIS
Transequatorial propagation
Grey line propagation
Sporadic E
Spread F
In order to gain a view of the state of the ionosphere for various forms of radio communication, a test instrument known as an ionosonde is used.
The test instrument is sometimes also known as a vertical incidence sounder, VIS, and this name gives an indication of the operation of the ionosonde.
Ionosondes, and the ionograms they produce are essential test instruments used for investigating the state of the ionosphere. The outputs they produce are able to give an indication of the state of the ionosphere above them that can be used to create a picture of what the ionospheric conditions are like at that moment.
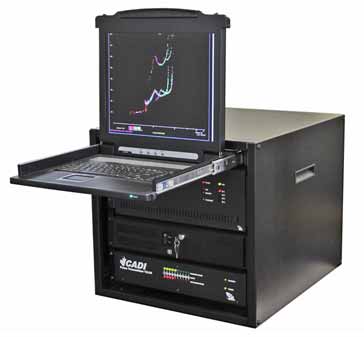
Courtesy of the manufacturer, Scientific Instrumentation Ltd., Saskatoon, Canada
By detecting the state of the ionosphere using an ionosonde it is possible to build up a picture of the actual state of the ionosphere at that moment and also at that point on the globe. Using a network of these test instruments around the globe a more accurate picture can be built up and this data can be used to determine the optimum frequencies for HF broadcasting and radio communication links, both short range and long distance radio communication.
What is an ionosonde
The concept of the ionosonde is that it is a form of test instrument that transmits pulses of RF power vertically upwards. It then receives the signal that is reflected and this shows many details about the ionosphere above it.

It can be seen from the diagram, that the signal is directed upwards towards the ionosphere. The signal rises and at some point it is possible that it is reflected back to Earth and received by a receiving antenna and system.
The signal is normally pulsed, like that of a conventional radar, and using the time delay for the returned signal, it is possible to determine the height of reflection.
Accordingly, it can be seen that the ionosonde is effectively a specialised form of pulsed radar that is used to detect the ionisation in the ionosphere.
The plot of the ionosonde output is called an ionograph and in early days this would have been printed out on paper, but modern systems will obviously use computer technology, storing the data for processing and display as required.
The signal from the ionosonde starts at a low frequency and is stepped up in frequency. Initially the signal is reflected back by the ionosphere, but as the frequency is increased it penetrates deeper into the relevant region and eventually passes on to the next ionised region where the same process occurs as the frequency is swept upwards. Eventually a point is reached where the signal passes though all the regions of the ionosphere and it is not reflected.
There is a time delay between when the signal is transmitted and the reflected signal is received. Knowing the speed that the signals travel, it is possible to convert this into a distance or height figure.
There is a variety of instruments that have been used over the years from different manufacturers and with different specifications but in essence they all provide the same function.
There have been many developments in ionosonde technology. Analogue systems were used up until the 1970s. These systems all swept through the relevant parts of the spectrum, normally from about 1 MHz up to between 15 and 25 MHz.
They generally used a relatively high power level, often up to 25 kW. Sweeps could take anywhere between about 30 seconds and 2 minutes which gave them the ability to look at relatively short term variations in the ionosphere.
Since the 1970s digital systems have been used. These provide essentially the same as the analogue ones, but provide considerably more facilities and they are able to manipulate the data far more easily as they use computing and digital signal processing technology.
Although it is possible to set up an ionosonde at almost any location required, a number of stations are located around the globe and data from many of them is stored at World Data Center A in Boulder USA.
A number of ionosonde stations are in operation around the globe, but with the reduction in use of the HF portion of the spectrum for radio communication, etc, there are fewer ionosondes in use, although some are accessed for occasional use for research.
What is an Ionogram
An ionogram is the form of plot that is produced by an ionosonde. It is essentially a plot of the altitude against frequency.
The vertical axis shows the height and the horizontal axis shows the frequency.

From the ionogram it is possible to see the critical frequencies for each of the ionospheric regions or layers. These are labelled as f0 for each layer or region. In other words f0 E is the critical frequency for the E region, etc.
From the diagram, it can be seen that the signal is sent upwards and initially it is absorbed by the D layer and no reflection is seen.
As the signal moves up in frequency, it starts to be reflected back to the ground by the E region and the delay in receiving the pulse enables the approximate height to be determined.
As the frequency increases, the height of the reflection increases as the signal penetrates further into the E region. Ultimately the rate at which the signal penetrates the region for a given increase in frequency increases as the signal reaches the point at which it passes through the region. The actual frequency at which it passes through the E region is called the critical frequency, f0 E.
Above f0 E, the signal reaches the F1 region (assuming the F region has split into two) and the process repeats. Again the same process repeats for the F2, until the signal passes through all the different regions and travels on into outer space.
In reality the actual ionograms are less distinct than the diagrammatic ones, but the same basic patters can be made out.
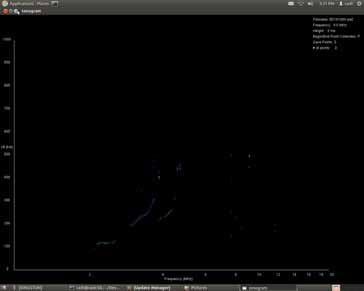
Although it is possible to obtain ionograms of the raw data from the ionosonde, most data these days is processed to provide more usable data and images.
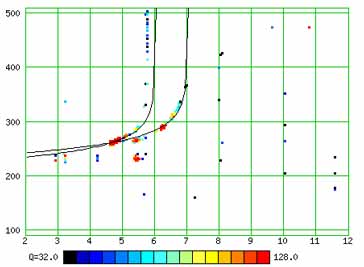
In this processed ionogram, the raw dots are the data from the ionosonde, and then the curves have been fitted to the data to more easily show the state of the ionosphere and the way in which it can support radio communication.
What is inside and ionosonde
Ionosondes are sophisticated items of test instrumentation. They are designed specifically for the purpose of testing the state of the ionosphere. Even though they have many similarities to other forms of pulsed radar, they are specialised because they are normally intended for use on frequencies between very approximately 1 MHz and 30 MHz.
Development history of the ionosonde
Modern ionosondes can trace their roots to the development of the early pulsed radar systems. They use exactly the same principles, although their application and the frequencies used are very different.
Although the first ideas for radar where postulated as far back as the very early 1900s, it was not until the onset of the Second World War that radar itself was used in a big way by both sides. The development of radar progressed a long way during this time.
In terms of the development of the ionosonde itself, thee first pulsed radar was developed in USA and there were experiments conducted using the technology to determine the height of a conducting layer in upper atmosphere. The test instrument was soon referred to as an ionosonde and it was further developed to improve its performance.
By the time the 1970s arrived, digital and processing technology started to affect te way ionosondes were designed. Using processing technology it was possible to process the results, rather than just having to manually analyze the raw data.
Another major impact on the development of the ionosonde was the introduction of the personal computer. This enabled the data from the ionosonde itself to be evaluated within a local computer. These personal computers were able to provide significant levels of processing.
Nowadays, most ionosondes are associated with a computer and screen to enable the data to be processed instantaneously producing instantaneous results, and also to link them to other ionosondes in a network to provide a more complete view of ionospheric conditions and improve broadcast reception as well as two way radio communications on the HF bands that are subject to ionospheric variations.
The use of ionosondes is a key method of determining the actual state of the ionosphere. With a number of these devices placed around the globe a good indication of the actual state can be determined and this can be used, along with other indicators, to predict the best frequencies to use for HF radio communication for both short ranges as well as long distance radio communication links.
More Antenna & Propagation Topics:
EM waves
Radio propagation
Ionospheric propagation
Ground wave
Meteor scatter
Tropospheric propagation
Antenna basics
Cubical quad
Dipole
Discone
Ferrite rod
Log periodic antenna
Parabolic reflector antenna
Phased array antennas
Vertical antennas
Yagi
Antenna grounding
Installation guidelines
TV antennas
Coax cable
Waveguide
VSWR
Antenna baluns
MIMO
Return to Antennas & Propagation menu . . .